Genealogy Map
Finding Your Roots is one of the best shows on TV. Writer and host Henry Louis Gates, Jr. deftly places the story of a guest’s family history into the context of past social and historical circumstances. The investigation into old records, DNA, and other clues often yield unknown ancestors and surprising connections.
I plan to make genealogy another theme in this blog. I’ve always been interested in my own family tree and what my ancestors may have experienced. Even before many records went online, I would spend time at the New York Public Library and other local archives to see if I could track down records and dates. Those were the days of microfilm, kids!

Microfilm on a reader spool.
Credit: ID 1230425 © James Knopf | Dreamstime.com
More recently, though, I combined my genealogy interests with some other interests in programming and visualizing data. There are certain kinds of maps that show a network of connections. One well-known example is Flight Patterns. I always wanted to know how such maps were made.
Fortunately, while looking into mapping with the R programming language, I came across essentially what I was looking for—a step-by-step tutorial about How to map connections with great circles. Now, I could use my own family data to map what I wanted, an emigration map!
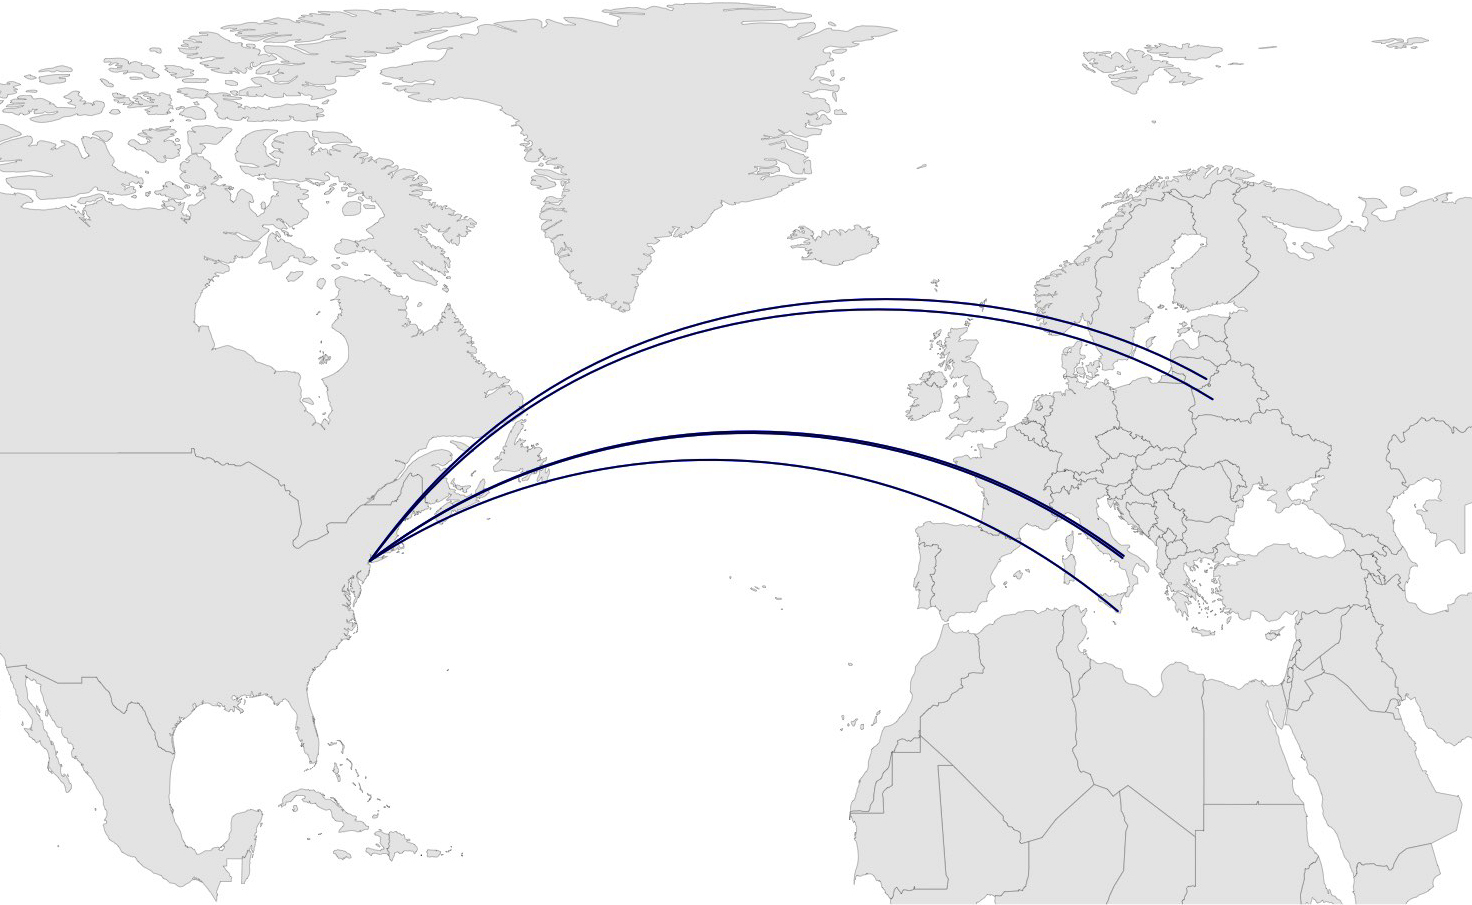
Family emigration map connecting my ancestors’ origins to New York City.
Visualization by Lee Patrick
Obviously, I’m not working from as many connections as flight data. So there are only a few arcs to show. And the arc that appears thicker than the others occurs because it is really two arcs that stem from neighboring towns in southern Italy. OK, maybe this isn’t the most revealing data map but it’s a start. Perhaps if I learn more R programming, I can add interactive features like dates, town names, and other information as you hover over the arcs.