Water Quality Testing Map
In my last post, Genealogy Map, I used the R programming language to create a very basic family history emigration map. I’m also interested in using R to interpret my volunteer activities at Coney Island Creek under the Community Water Quality Testing program.
For a start, I’m posting a dump of map images I created using arcs to show the network of water sampling sites and testing labs that make up the program. There are nearly 90 sampling sites around New York City and New Jersey, and volunteers deliver those samples to 16 partner testing labs. Like my last post, this is my first go-round working on these, so I need to add labeling and a legend. Ultimately, you’ll also be able to rotate and zoom into the map.
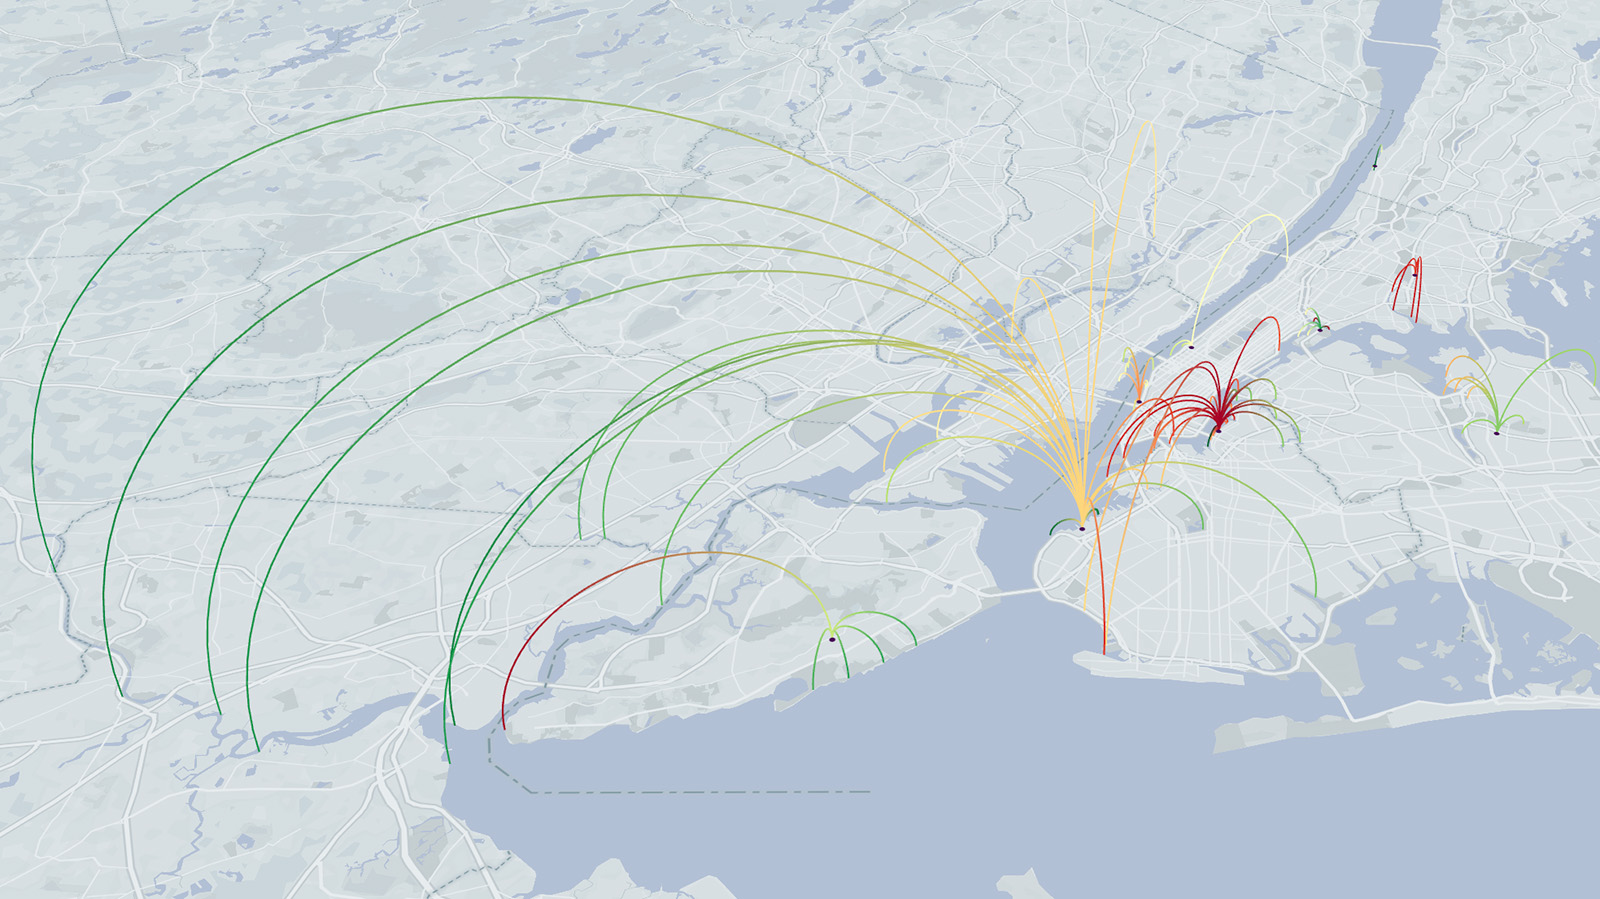
Network of water sampling sites and testing labs (looking north).
Visualization by Lee Patrick
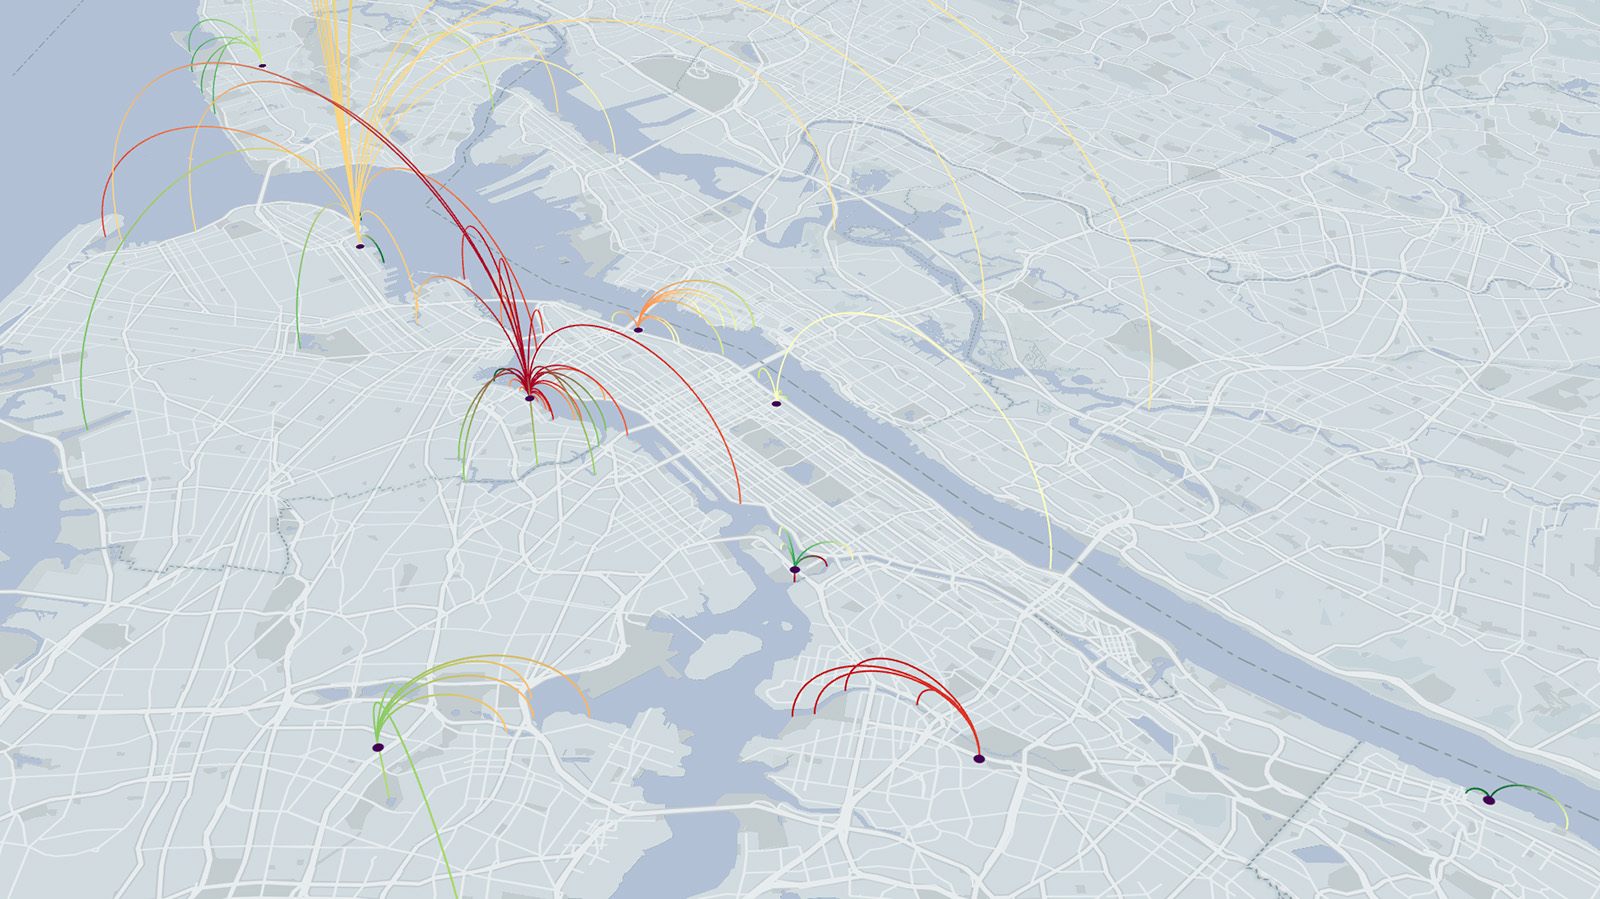
Network of water sampling sites and testing labs (looking south).
Visualization by Lee Patrick
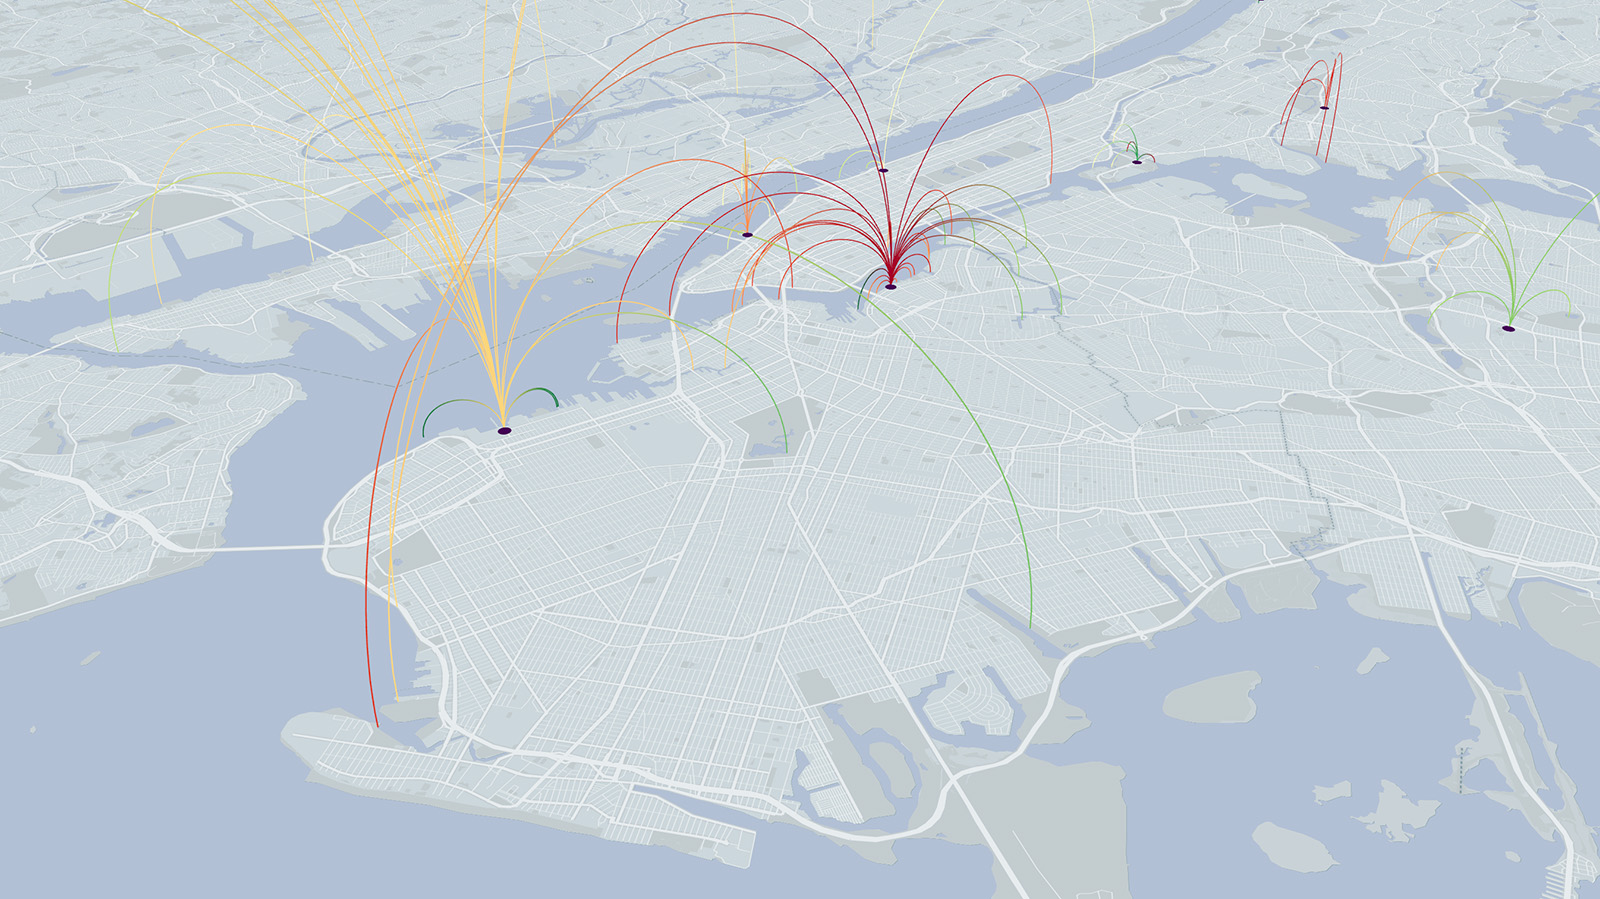
Network of water sampling sites and testing labs, focusing on Brooklyn.
Visualization by Lee Patrick
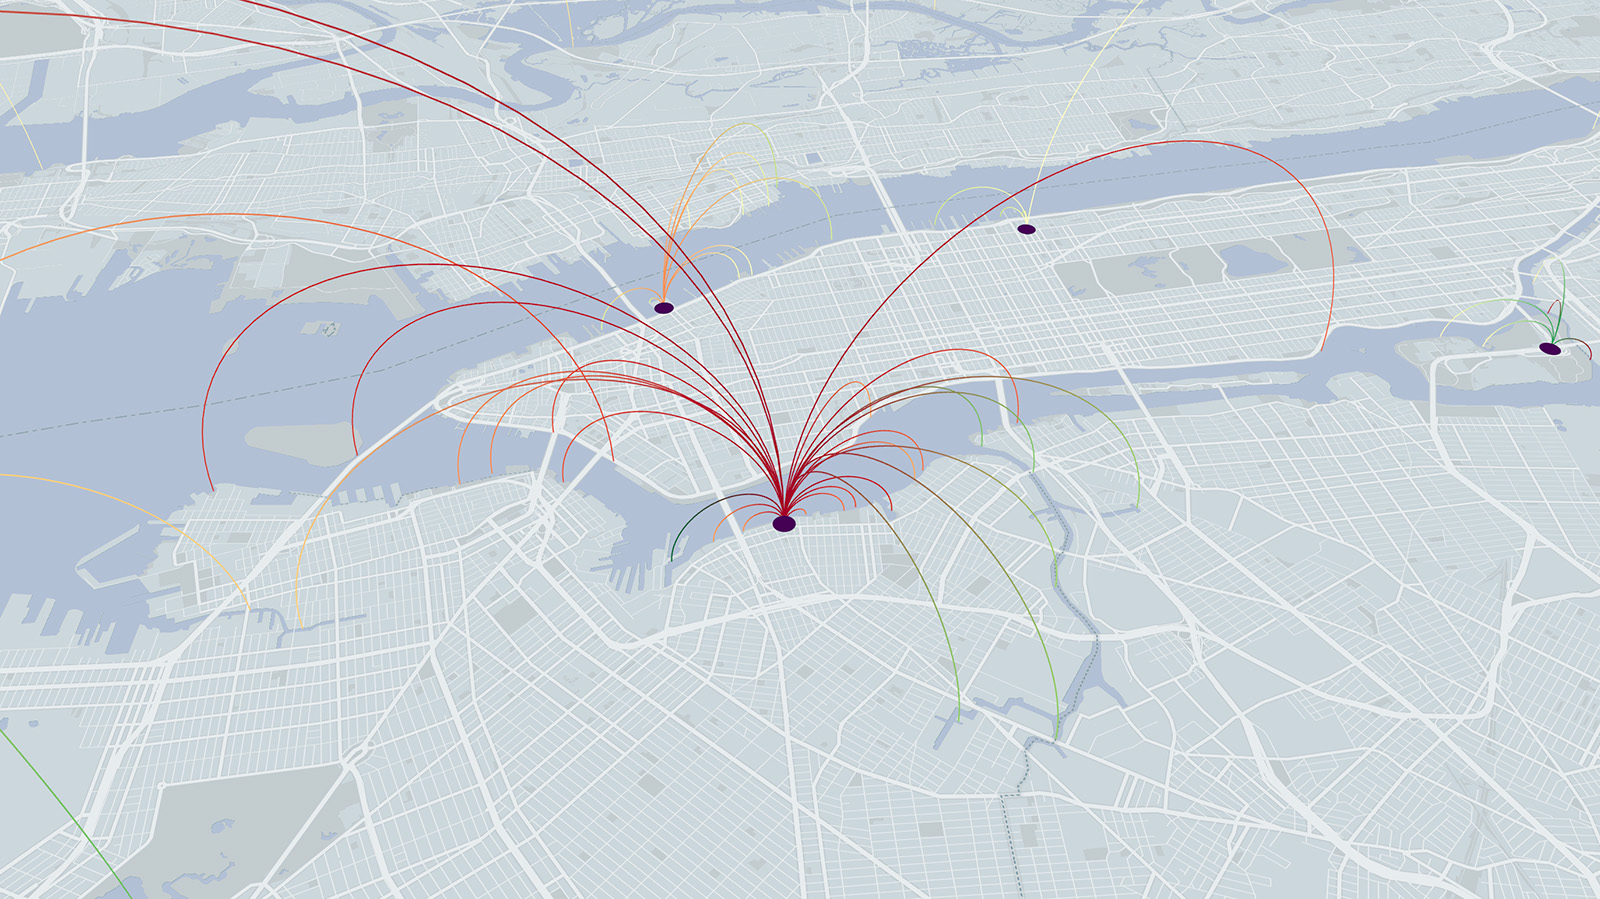
A focus on sites that deliver to the Williamsburg testing lab (center).
Visualization by Lee Patrick
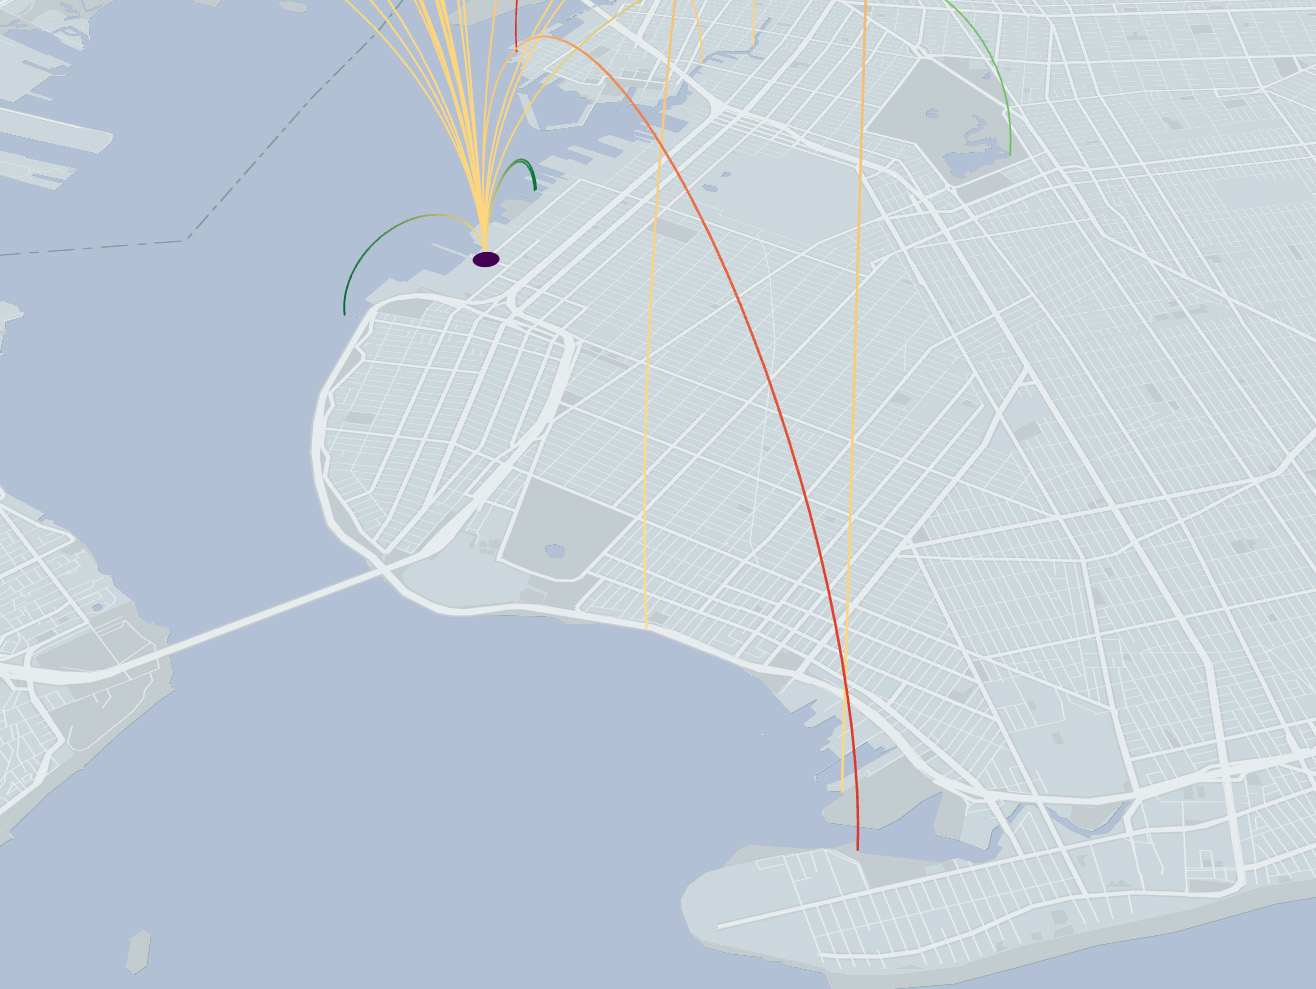
Red arc leading from my sampling site in Coney Island to a testing lab at the Brooklyn Army Terminal.
Visualization by Lee Patrick